Got great customer satisfaction ratings? Or, is loyalty slumping? Whether you’re celebrating your performance or figuring out how to fix it, the best way to do that is to start by understanding what’s driving it. And that’s where key driver analysis comes in. Key driver analysis is a powerful technique that gives you insight into the factors, or drivers that are most important to customers—which therefore have the greatest potential impact on your performance.
What is key driver analysis?
Key driver analysis (KDA) which you might sometimes see described as relative importance analysis, essentially looks at a group of factors, and weights their relative importance in predicting an outcome variable. It can be a big part of your market research. Outcome variables are usually performance indicators such as customer satisfaction, customer loyalty, or Net Promoter Score (NPS). Whether these scores are high or low, it is useful to know the factors driving them. By comparing the relative importance of factors like price, reliability or status, you’ll be able to answer questions like:
- Is it best to position our brand as premium or prestige?
- What can we do to grow customer retention?
- To improve sales, should we concentrate on increasing quality or reducing prices?
What are key drivers?
Drivers are all of the factors that could potentially impact your measure of performance. The factors that most meaningfully drive performance outcomes are known as key drivers. Likely, you will have a mix of these, and the precise mix will differ depending on your company. For instance, if you run a tax preparation consultancy, the potential drivers affecting customer satisfaction might be:
- Knowledgeability of the tax preparer
- Ability of the tax preparer to increase tax refunds
- Level of professionalism
- Price of the service
What key driver analysis does is enable you to compare the relative contribution that each of these four drivers makes to the satisfaction of your customers. Each relative contribution is known as an importance weight, and typically adds up to 100 (as in the example below), or to the R-square statistic.

In the example above, the ability of the tax preparer to increase tax refunds makes the greatest contribution to the satisfaction of the tax consultancy’s customer base. Of lesser importance is the professionalism of the tax agents. Insight like this can be crucial in helping you to deliver great customer satisfaction or raise performance.
Imagine, for instance, as the owner of this business, you want to focus your efforts on improving customer satisfaction, but you only have a small budget. Using the results of your key driver analysis, you might decide to focus on training tax professionals on the latest tax reforms and changes to deductions so that your customers stand the best chance of getting a refund.
But how do you get to this insight? First, you need to start with a survey.

Start understanding your audience—quickly
Complete online panel research in minutes, not months so you can hit the ground running with targeted campaigns.
When to use key driver analysis with survey data
Key driver analysis relies on survey data that captures some aspect of performance from the perspective of your customers. In the first instance, you’ll need to decide what output variable to measure. For customer-facing businesses like retailers and e-commerce sites, it usually makes sense to ask questions that capture customer satisfaction, by asking a question like “How satisfied were you with your purchase?” Other typical metrics are customer loyalty, repurchase intentions, or willingness to recommend the business to a friend or acquaintance.
Identify likely drivers
Next, you need to identify some likely drivers. These are also known as independent variables, or predictor variables, because they predict the main outcome. You should choose drivers that make sense based on the outcome metric you’re evaluating. Typical drivers are price, convenience, quality, packaging, or anything at all you expect to drive customer satisfaction, happiness or other measures of your performance.
Use discrete variables
Whatever you choose, it makes sense to use discrete variables to measure both predictor and outcome variables. A discrete variable is a numeric variable that can take on a set number of values between two scores. For example, you might ask respondents to indicate their satisfaction with a recent purchase on a scale of 1–10. Capturing scores in this way is vital when it comes to the correlation and linear regression analyses, which we’ll cover below.
How to perform key driver analysis
Once you’ve gathered your survey data, you can start performing your analysis.
Calculate performance
First, you should measure the weighted performance of each of the drivers from your survey. Exactly how each driver will be weighted will depend on how you have gathered your data.
For example, let’s imagine you’ve asked your respondents how happy they're after their latest shopping trip at your store. Specifically, you ask them to rate the availability of products, the prices, the convenience of the store layout and the friendliness of the customer service on a 5 point scale from 1 (very unhappy) to 5 (very happy). In this case, the weights for each driver will be assigned on a scale from 1–5, and the individual performance of each driver can be viewed as a percentage of the overall weighted score. If you asked these questions to 60 respondents, you might end up with a summary of scores like this:
| Very unhappy (1) | (2) | (3) | (4) | Very happy (5) | Weighted score | Performance | |
| Product availability | 20 | 20 | 10 | 0 | 10 | 2.33 | 26% |
| Prices | 5 | 25 | 20 | 35 | 15 | 3.78 | 34% |
| Convenience | 10 | 15 | 45 | 20 | 10 | 3.33 | 22% |
| Friendliness | 25 | 5 | 10 | 40 | 20 | 4.18 | 18% |
N=60
Calculate correlations
A correlation measures the existence of a relationship between two variables of interest—in this case, each predictor variable (independently) and the outcome variable. Each correlation is represented by a figure called the correlation coefficient which can range from -1 to +1, with positive scores indicating a positive relationship between the pairs of variables, while negative scores indicate a negative relationship.
For example, if the correlation coefficient between perceived level of friendliness of customer service agents and customer happiness is 0.15, this means that as customers’ perceptions of friendliness increase, customer happiness increases (or, as perceived friendliness falls, so does customer happiness). In contrast, a correlation coefficient of -0.15 means that customer happiness increases as friendliness decreases—a strange finding, but perhaps not impossible.
However, whether the value of the correlation coefficient is positive or negative is not enough to make inferences. The value itself is also important and measures the amount by which the overall metric will change for every one-point change in the driver’s weight score. In general, you can follow this rough rule of thumb:
- Coefficients between 0 and 0.3 indicate a low strength relationship
- Coefficients between 0.4 and 0.6 indicate a moderate strength relationship
- Coefficients between 0.7 and 1 indicate a high strength relationship
So, in our example above, a correlation coefficient of 0.15 between friendliness and customer happiness would indicate a low strength, positive relationship. Now, let’s say we find that the correlation between availability of products and customer happiness is 0.8. This is a high strength, positive relationship, and would indicate that you should concentrate more effort in making sure your products are on the shelves at the right time than in making sure your sales agents are friendly.
Calculate linear regression
The final step in key driver analysis is to use linear regression to determine the relative weight of each correlation between each key driver and the outcome variable being tested.
Linear regression analysis works by testing all the pairwise correlations between the independent variables (the drivers) in order to yield the optimal linear combination that would predict the outcome variable. It distinguishes the relative contribution of each driver to the outcome, and also generates an R-squared value which measures the contribution of all drivers together. The R-squared value can range from 0 to 1 and is converted into a percentage. The closer the number is to 1, the greater explanatory power the model has. For example, an R-Squared of 0.82 for our earlier customer happiness example means that 82% of the variance in customer happiness can be explained by our four variables (product availability, prices, store layout convenience and friendliness).
Another way to look at it is that 18% of the variance in customer service is unexplained, and there are drivers (like the length of the queue at checkout, or the ease of parking) which have not been evaluated and which may also matter.
Reading a key driver analysis 2 x 2 chart
The results of your key driver analysis can also be visualized on a 2 x 2 matrix or chart. The y-axis shows your outcome measure (e.g. customer satisfaction), and the degree of importance of the driver is shown on the x-axis. After you’ve plotted each driver against these two measures, you’ll find that they fall into one of four regions:
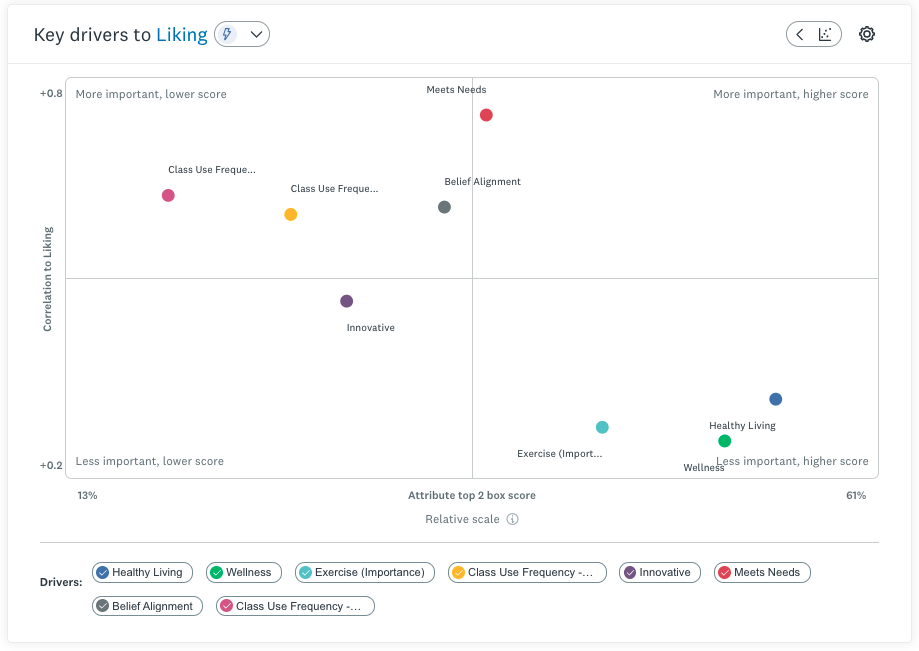
Drivers that fall in the upper right quadrant of the matrix are the key drivers, or critical attributes. These drivers play the most significant role in driving performance and are the area where you should be focusing investment and resources.
The upper left quadrant contained secondary drivers which are also important in driving performance, but not as much as the key drivers. The bottom left quadrant contains low impact drivers. Customers see these factors as unimportant, or, they have a limited impact on satisfaction or whatever outcome you’re measuring. Finally, factors that fall in the bottom right quadrant of the matrix are the areas in need of improvement, but less important to customers.
Benefits of key driver analysis
As you can see, key driver analysis is relatively straightforward to perform, but it can be immensely powerful. The major benefits to this type of analysis are:
- You really understand customer behavior
Sometimes, observing customers’ actions can lead you to believe that certain factors are important in explaining their habits and behaviors, when in fact, those factors are actually not very important.
For example, imagine you observe grocery store customers visiting two different supermarkets across the street from one another. The parking lot of the cheaper store is full, and the parking lot of the premium store, which you own, is quite empty. This might make you think that customers place greater weight on prices, making you wonder whether to drop your prices in line with your competitor’s. Through a survey-based key driver analysis, however, you might find that your store’s parking lot is difficult to access, or that your rival has friendlier members of staff—actionable insight that can help you regain custom!
- It helps you prioritize limited resources
As we’ve seen, key driver analysis not only tells you the bundle of drivers that affect your outcome of interest, but it also tells you the drivers that have the strongest influence. This is especially useful where resources, and budgets are limited. For example, let's say you have a limited marketing budget that could be spent on either revamping your packaging, or a new set of advertisements. By identifying which of those matter most to your customer perceptions of your brand, you can focus your investment in a way that is more likely to improve brand performance.
- You can compare customer segments
Combined with customer attribute data, like demographic data, you can compare the key drivers of your various customer segments. This is very useful if you expect different customer segments to have different preferences and drivers. For example, older grocery store shoppers might place greater emphasis on prices, and younger shoppers might be looking for a broader product range. Identifying the key drivers for each segment can help you to more effectively target your messaging and marketing campaigns.
- Use the insight to make predictions and build simulations
The data that our key driver analysis does not only give you insight into current key drivers—it actually is the basis of a predictive model that can be used as a decision making tool to run a number of what if scenarios. For instance, you might use the tool to determine the impact on customer happiness if average prices fell by 10%.
Key driver examples
Let’s take a look at some specific examples of where key driver analysis might be used.
Satisfaction
Satisfaction is a very common metric tested through key driver analysis. As we’ve discussed elsewhere, satisfaction is a major contributor to customer loyalty, and loyal customers are lucrative customers. Identifying the key drivers of customer satisfaction can therefore play a crucial role in driving sales and profits.
Net Promoter Score (NPS)
Another common outcome measure is the Net Promoter Score, or NPS. The NPS helps you to understand what customers really think of your company or offerings by posing one very simple question: How likely is it that you would recommend this company to a friend or a colleague?
Answers are usually recorded on a discrete range from 0 (very unlikely) to 10 (very likely). What’s great about the Net Promoter Score is that it helps you understand whether customers are willing to advocate for you—and that’s very cheap, but very effective marketing! Learning the key drivers of NPS can therefore help you increase your customer reach and build your brand. Read more about how to calculate Net Promoter Score.
Purchase intent
Purchase intent measures whether customers have an intention to buy your product in the near future. Applying a key driver analysis can help you determine the factors that shape buying behavior, which will help you to identify the factors that should be manipulated to push sales. You can assess attributes of your products or services, but also attributes of your competitors. For instance, you might ask about your prices and the prices of a near substitute, using KDA to determine the relative influence of each on purchasing habits—vital information to support your competitive strategy. Purchase intentions can also be captured from prospective, rather than existing customers.
Category drivers
Sometimes, sales of products drop dramatically, which might leave you scratching your head as to why. Key driver analysis can play a key role here. It will help you to understand and compare the drivers of multiple categories, so you can better learn where to focus your efforts to bolster sales. To do this, you might administer a survey that asks the same factors about different product categories. For instance, if you have two laundry detergents (a biological and a non-biological version), you can compare the relative impact of the prices of each on the performance of each brand.
Improve your performance with surveys
When trying to improve your performance, it can be challenging to know what to prioritize and where to focus your investment. As we’ve seen, key driver analysis helps you understand what factors really really matter to your customers, and to compare the performance of each factor. From there, you can make much better informed decisions about where improvements need to be made, or what needs to simply be sustained. Ready to start your survey? We can help with our marketing solutions. Get started
Get started with your market research
Global survey panel
Collect market research data by sending your survey to a representative sample
Research services
Get help with your market research project by working with our expert research team
Expert solutions
Test creative or product concepts using an automated approach to analysis and reporting
To read more market research resources, visit our Sitemap.